Part 4: Loading Data
Copy this CSV file
Before we take our last step and load some data, we'll need some data to load.
The CSV file looks like this:
timestamp,max_temp_c,min_temp_c
2025-03-23T00:00:00Z,11.7,-1.5
2025-03-24T00:00:00Z,8.4,-2.0
2025-03-25T00:00:00Z,10.9,-2.2
...
Download this CSV file and put it somewhere convenient in your local file system. Since I'm on Mac, I'll put mine in /Users/Shared/hydroserver-101/. The trick is to pick a directory that LoggerNet has permissions to write to and the Streaming Data Loader has permissions to read from. A couple of good spots:
- Windows:
C:\CampbellSci\LoggerNet\(where LoggerNet usually writes already), or a fresh folder likeC:\ProgramData\sdl\data\ - macOS:
/Users/Shared/LoggerNet/ - Linux:
/var/loggernet/
Where not to put them
These spots will cause problems, usually because the Streaming Data Loader runs as a system service and can't reliably see into a single user's account:
- Your home or user folders -
~/on macOS/Linux, orC:\Users\<you>\on Windows. This includes Desktop, Documents, and Downloads. - Temp directories like
/tmporC:\Windows\Temp- these get cleared out from under you - Program install folders like
C:\Program Files\- these are read-only by convention - Network shares or cloud-synced folders (Dropbox, OneDrive, an SMB/NFS mount) - file tracking gets unreliable when another tool can move or rewrite the files
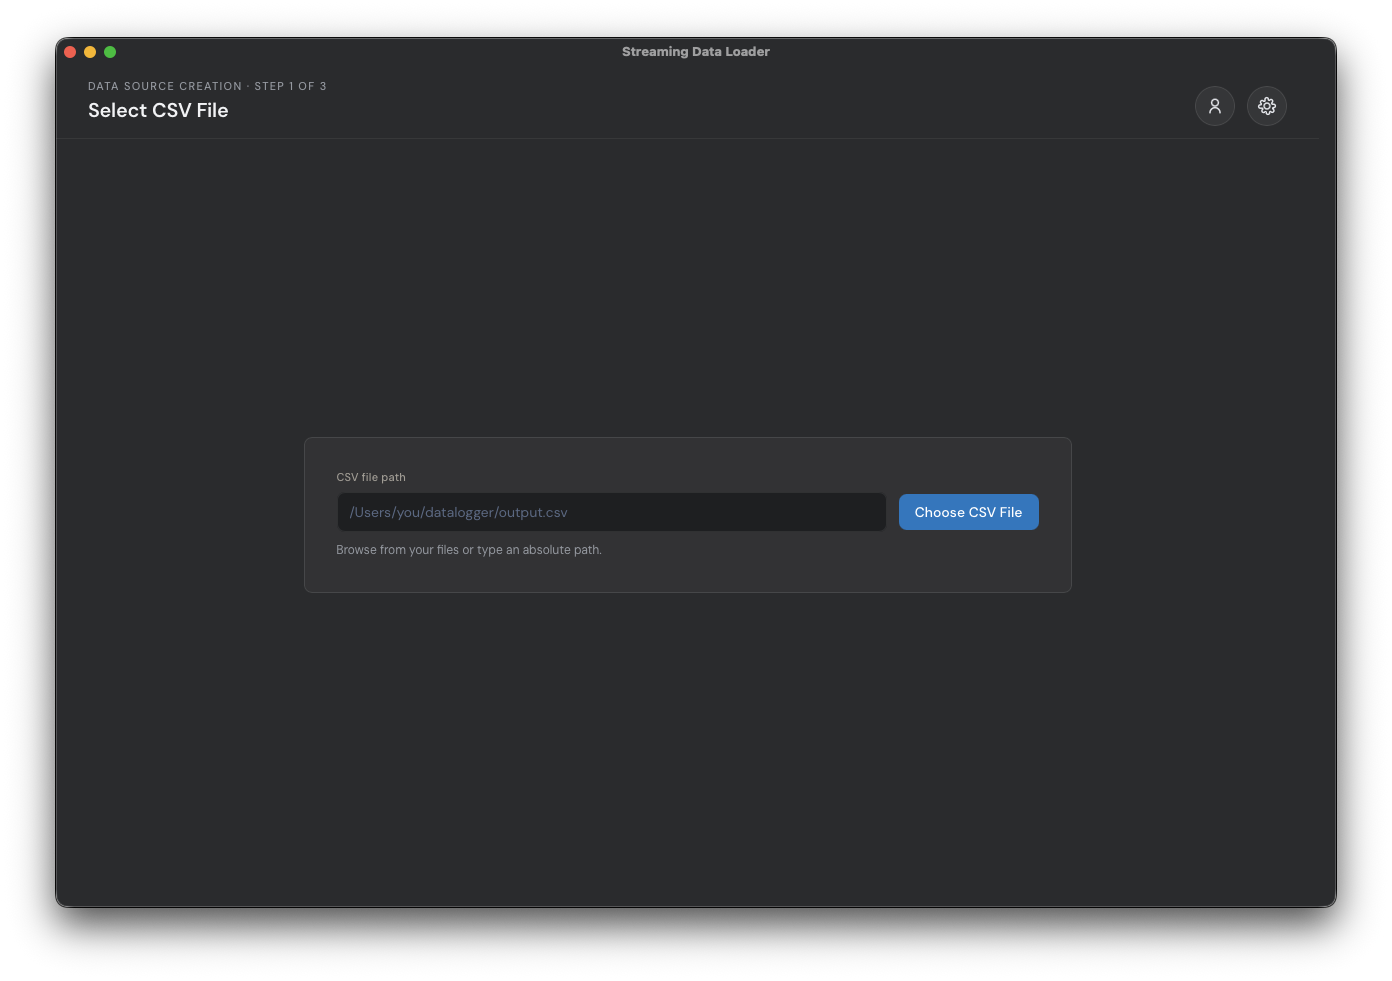
Select CSV file
From the Streaming Data Loader, click 'Choose CSV File' and navigate to where you put the newly downloaded daily_temp.csv file.
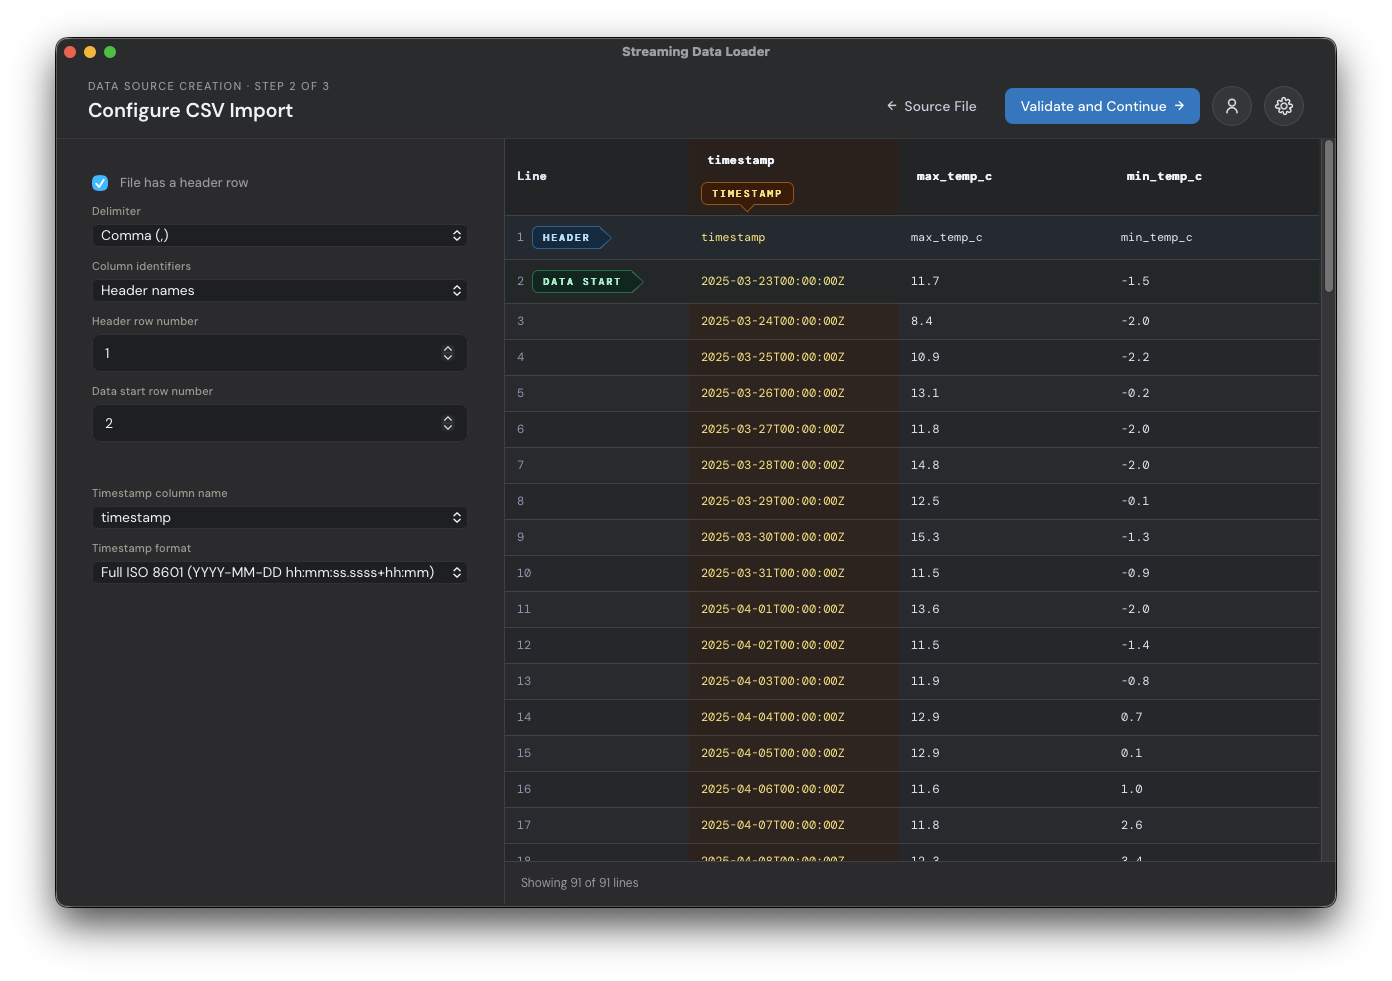
Once the file is selected, the application will attempt to detect the start row for the headers and data, and the column that contains the timestamps. In the below example, the app correctly filled out the form for me. If anything looks wrong, you can drag the row and column selectors on the right or use the form fields on the left. Once everything looks correct, click 'validate and continue'.
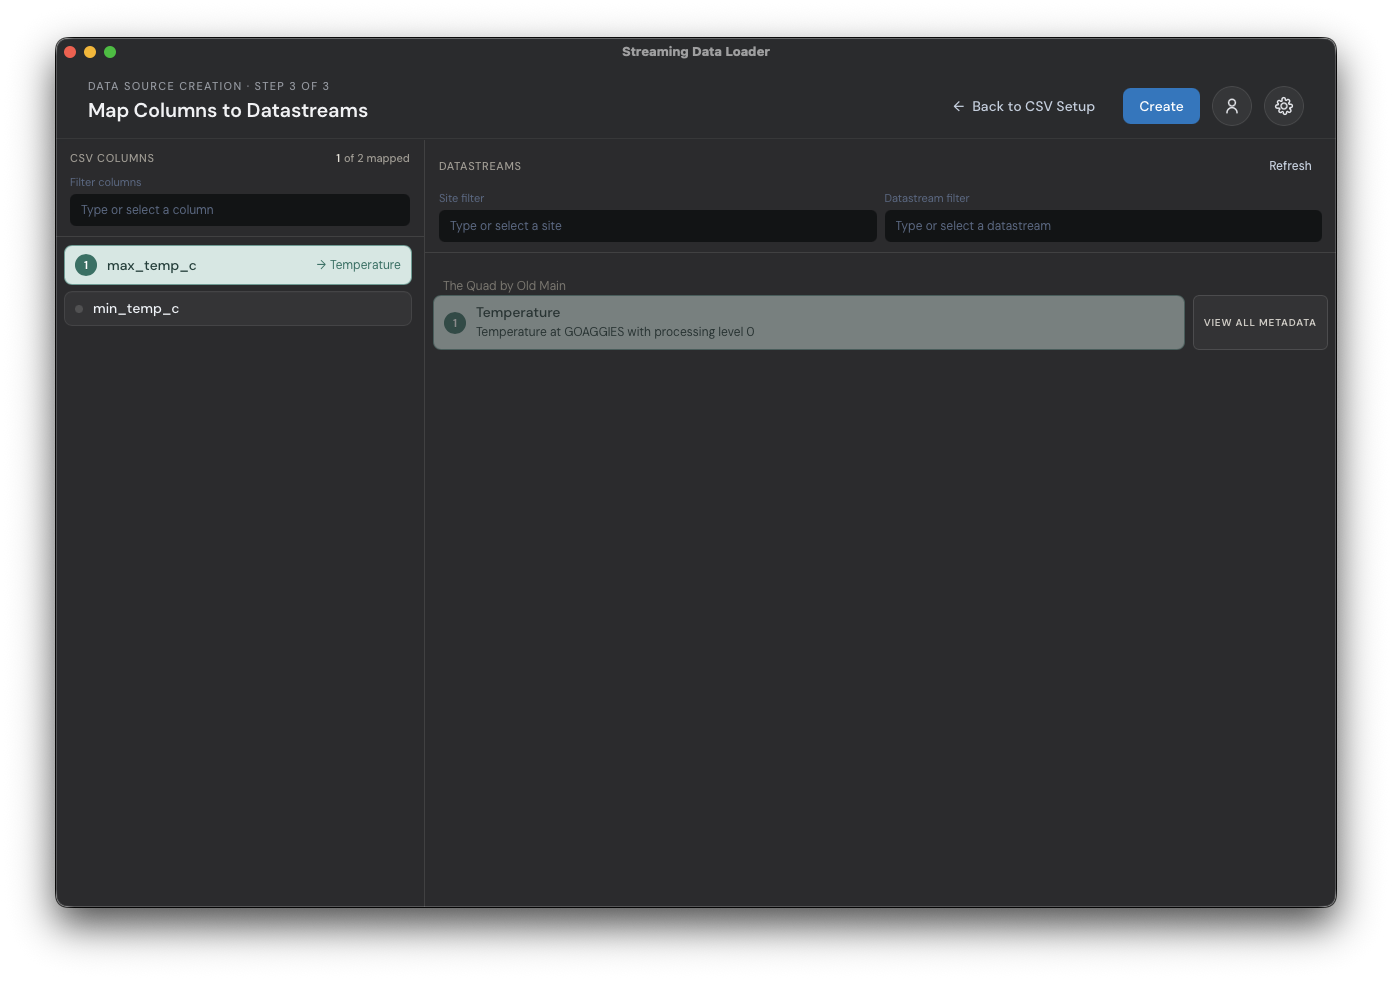
The next screen acts as a sort of connect-the-dots interface that will let you map the source CSV columns to their related target datastreams. Notice our two CSV columns max_temp_c and min_temp_c on the left. For now, we only care about loading max_temp_c. Select the list item with that label, then select the single 'Temperature' datastream we created in part 2 of this tutorial. When properly selected, the source and target will share the same color and number like the image below. Click 'Create' to finish creating this data source.
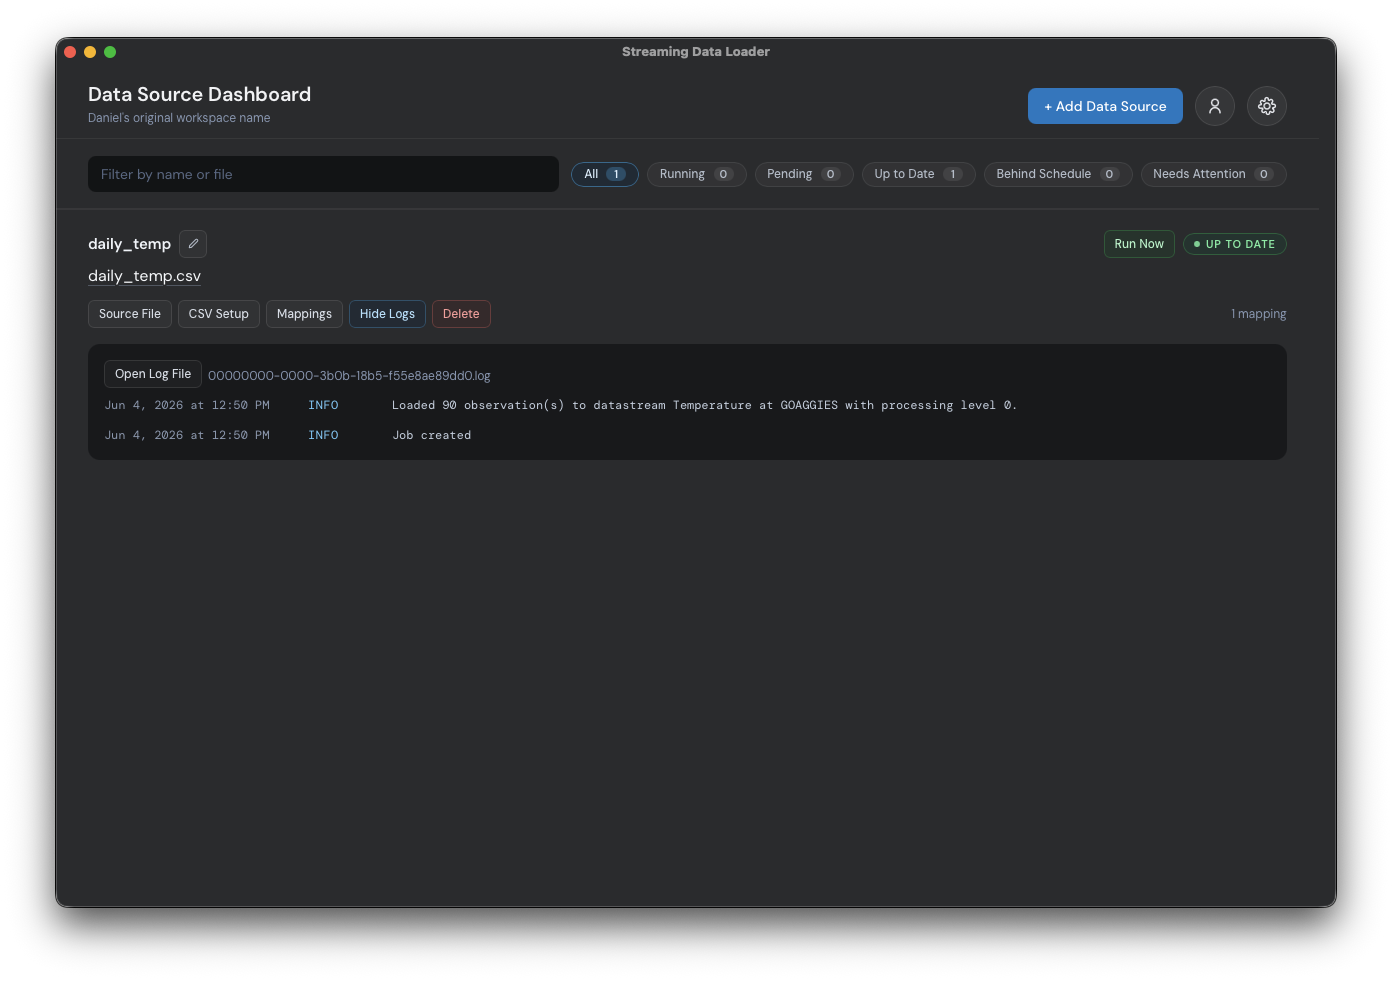
Clicking the 'create' button will bring you to the main dashboard where you'll see a list of all of your data sources. Here you can manage your existing data sources. Of course, we currently only have one. Click the blue 'show logs' button. If everything went well, you'll see that the loading job was created and ran. If anything went wrong, you'll see a user-focused message explaining what needs to be done to fix the data source.
Visualizing Your Data
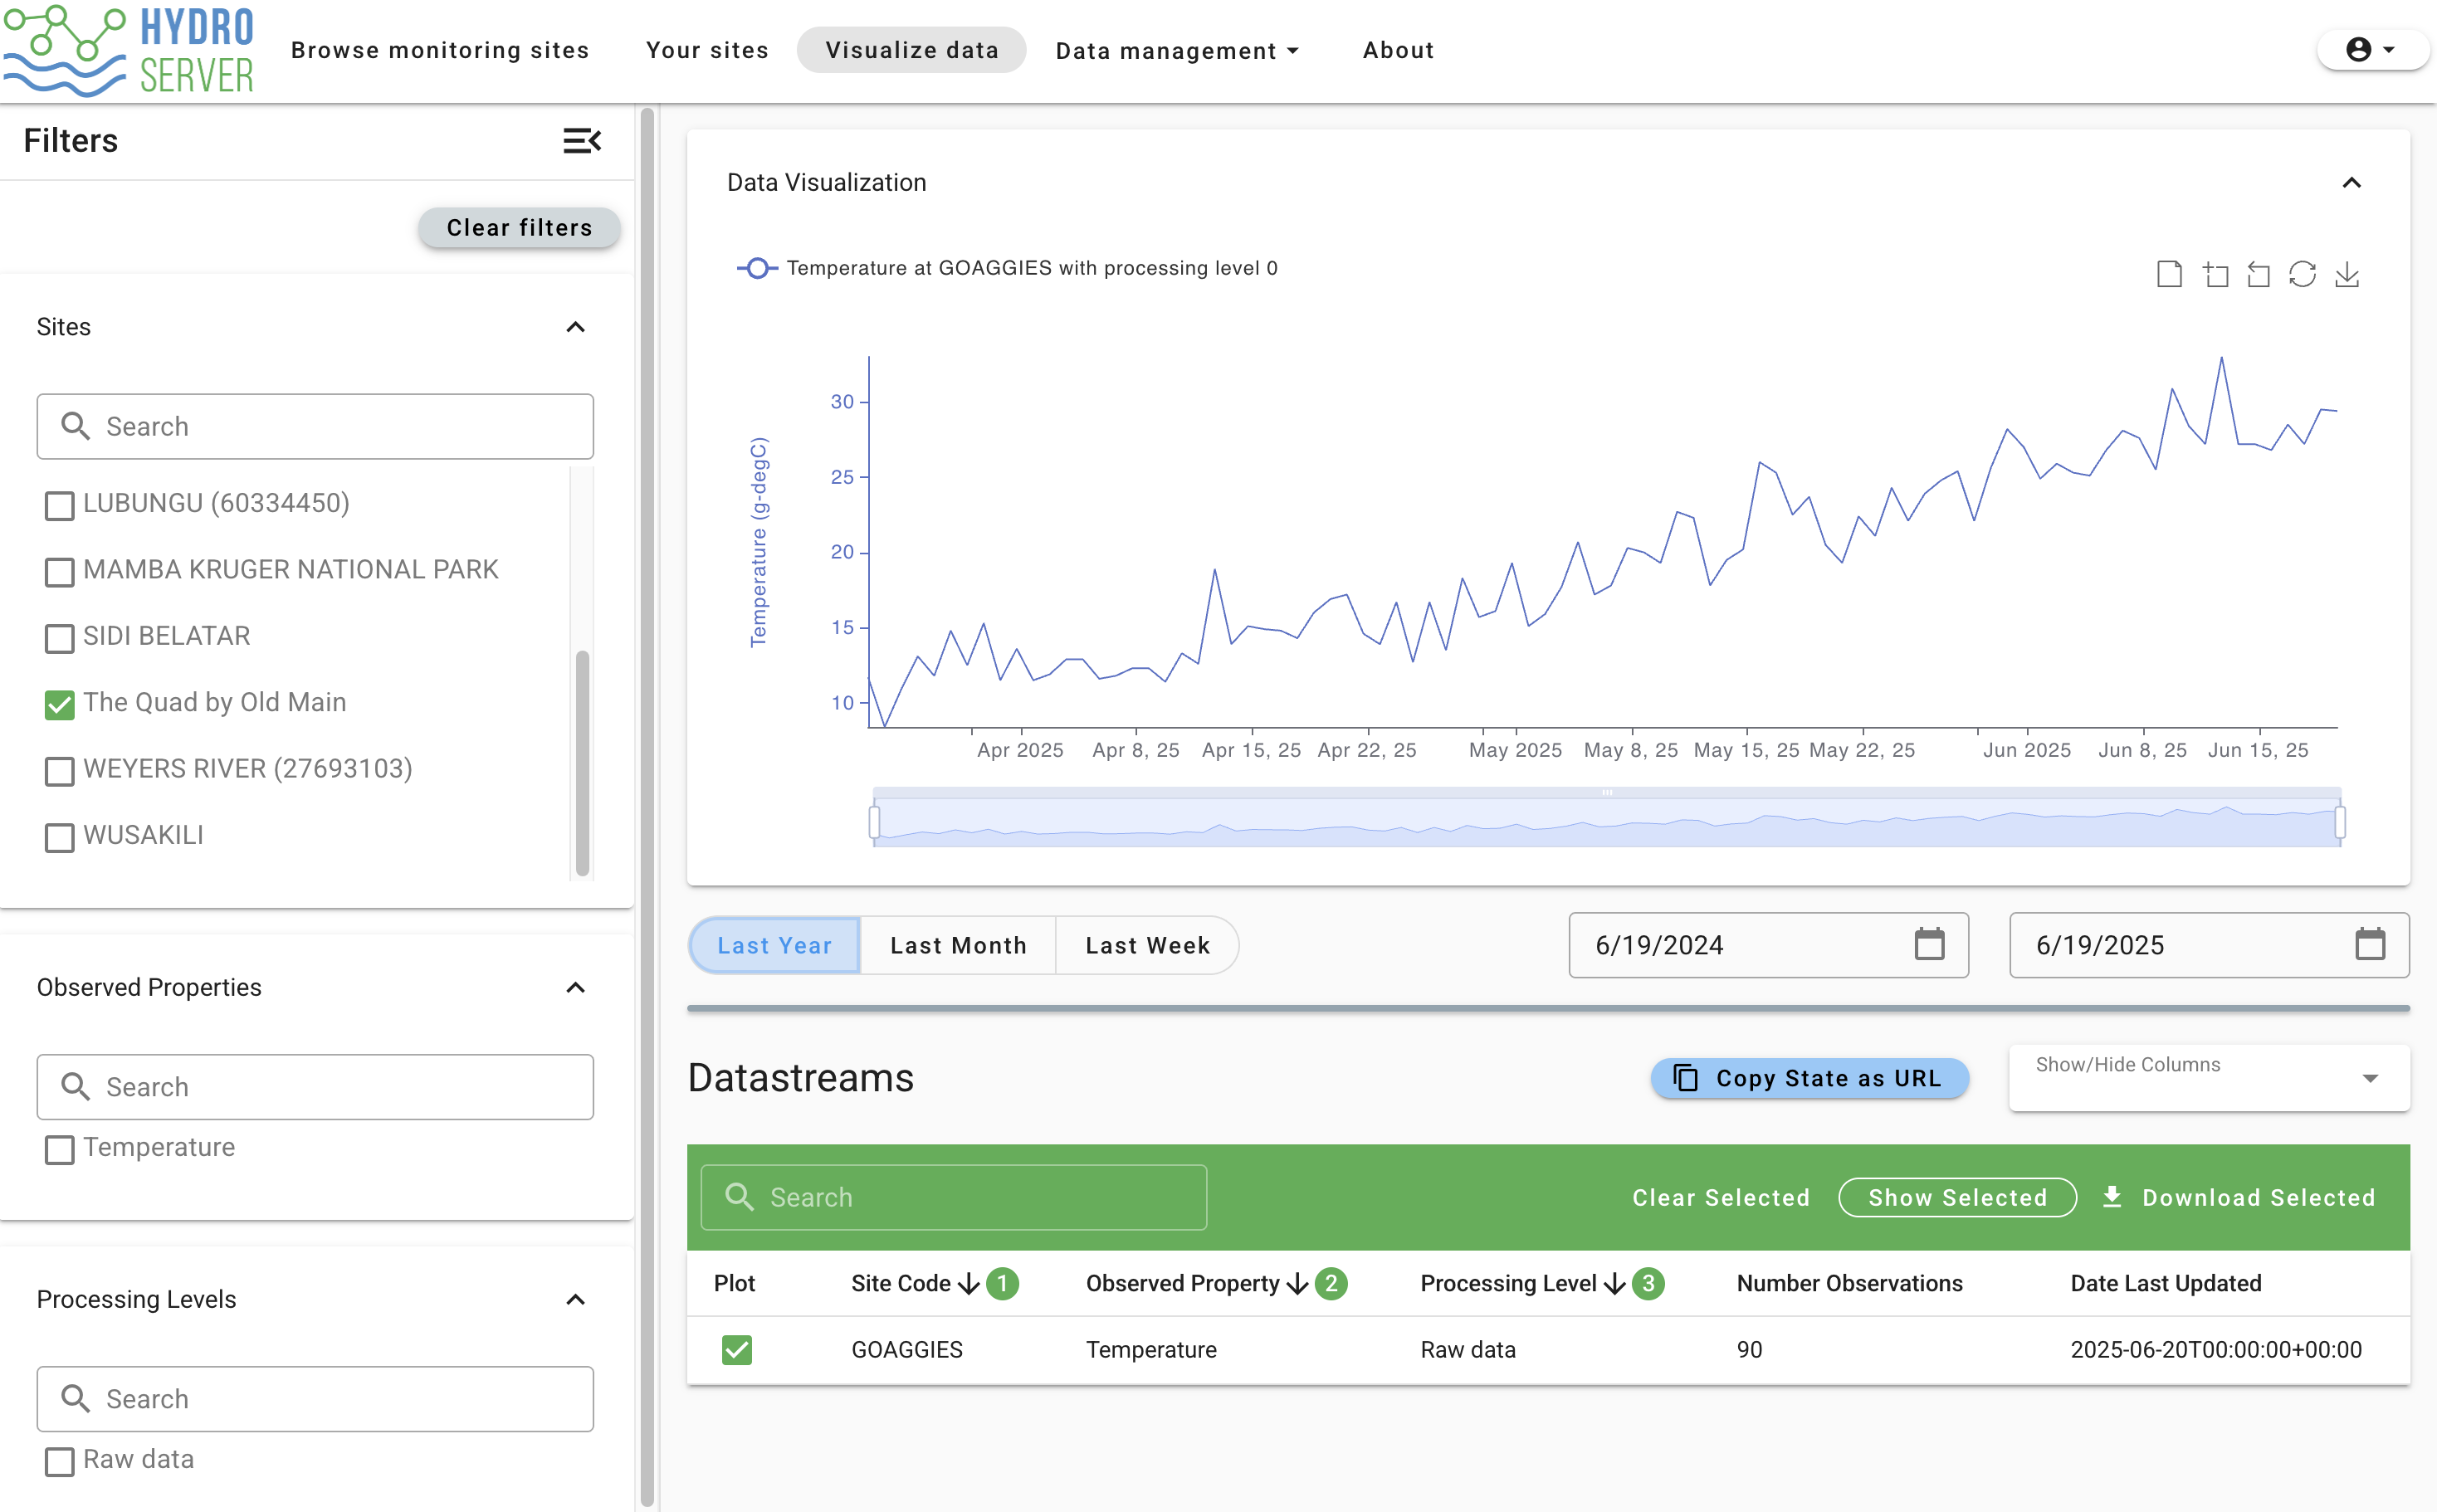
Congrats! You've completed this tutorial! To visualize your newly pushed data, click 'Visualize data' on the main navigation bar in the Data Management App. This will take you to a page where you'll see all the public data on the playground instance and your data regardless of if it's public or private (don't worry, private data still can't be seen by others). Use the 'Workspace' filter on the left to make it easier to find your datastream in the list. Select your datastream in the Datastreams table and you should see something like this:
Where to go from here
We recommend solidifying your knowledge by trying out some data loading workflows on your own. To start, you might:
- Create a second datastream for the min_temp_c column we ignored earlier in the tutorial and update your data source in the Streaming Data Loader to load both min and max temp.
- Try loading data from a real data logger file
Once you're comfortable with these concepts, head over to the Getting Started With hydroserverpy tutorial to see how you can manage large amounts of data with Python scripts.