Loading data
Copy this CSV file
Before we take our last step and load some data, we'll need some data to load. Download this CSV file and put in somewhere convenient in your local file system. I'll put mine on my desktop.
The CSV file looks like this:
timestamp,max_temp_c,min_temp_c
2025-03-23T00:00:00Z,11.7,-1.5
2025-03-24T00:00:00Z,8.4,-2.0
2025-03-25T00:00:00Z,10.9,-2.2
...
For now, we only care about the 'timestamp' column and the 'max_temp_c' column. We need to tell the Streaming Data Loader to grab only the data for those two columns and push them to our datastream. This is exactly what a data connection does.
Create a data connection
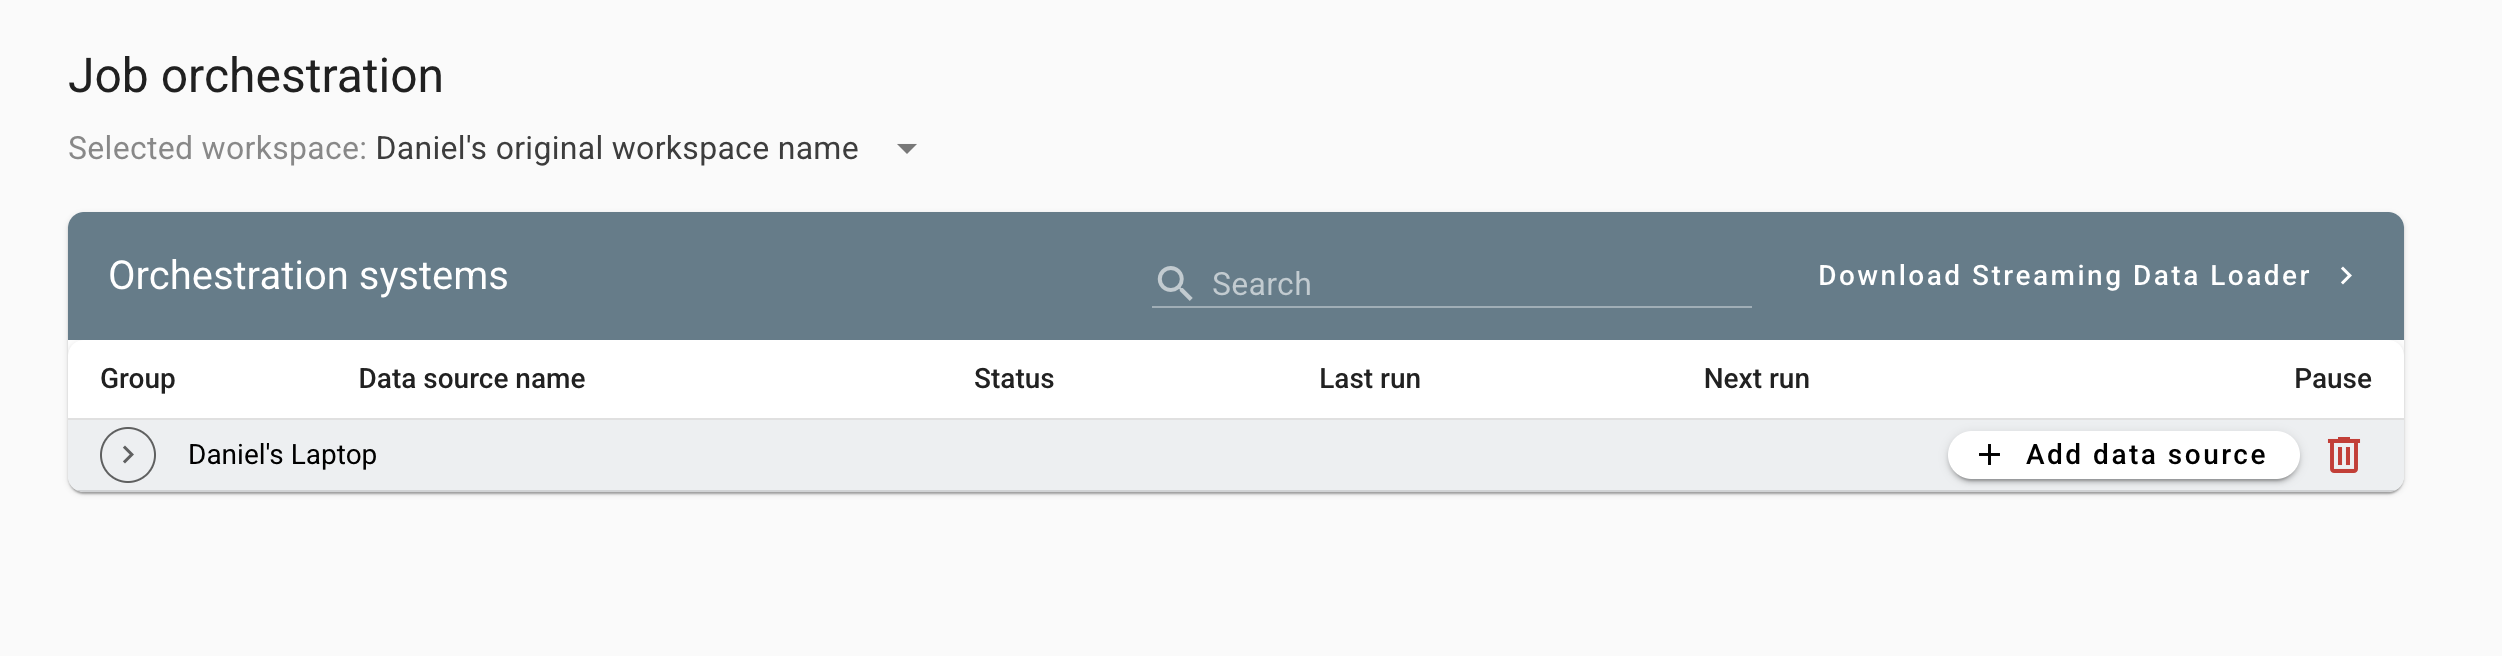
On the Job Orchestration page, on the right side of your new orchestration system's row, click the 'add data connection' button.
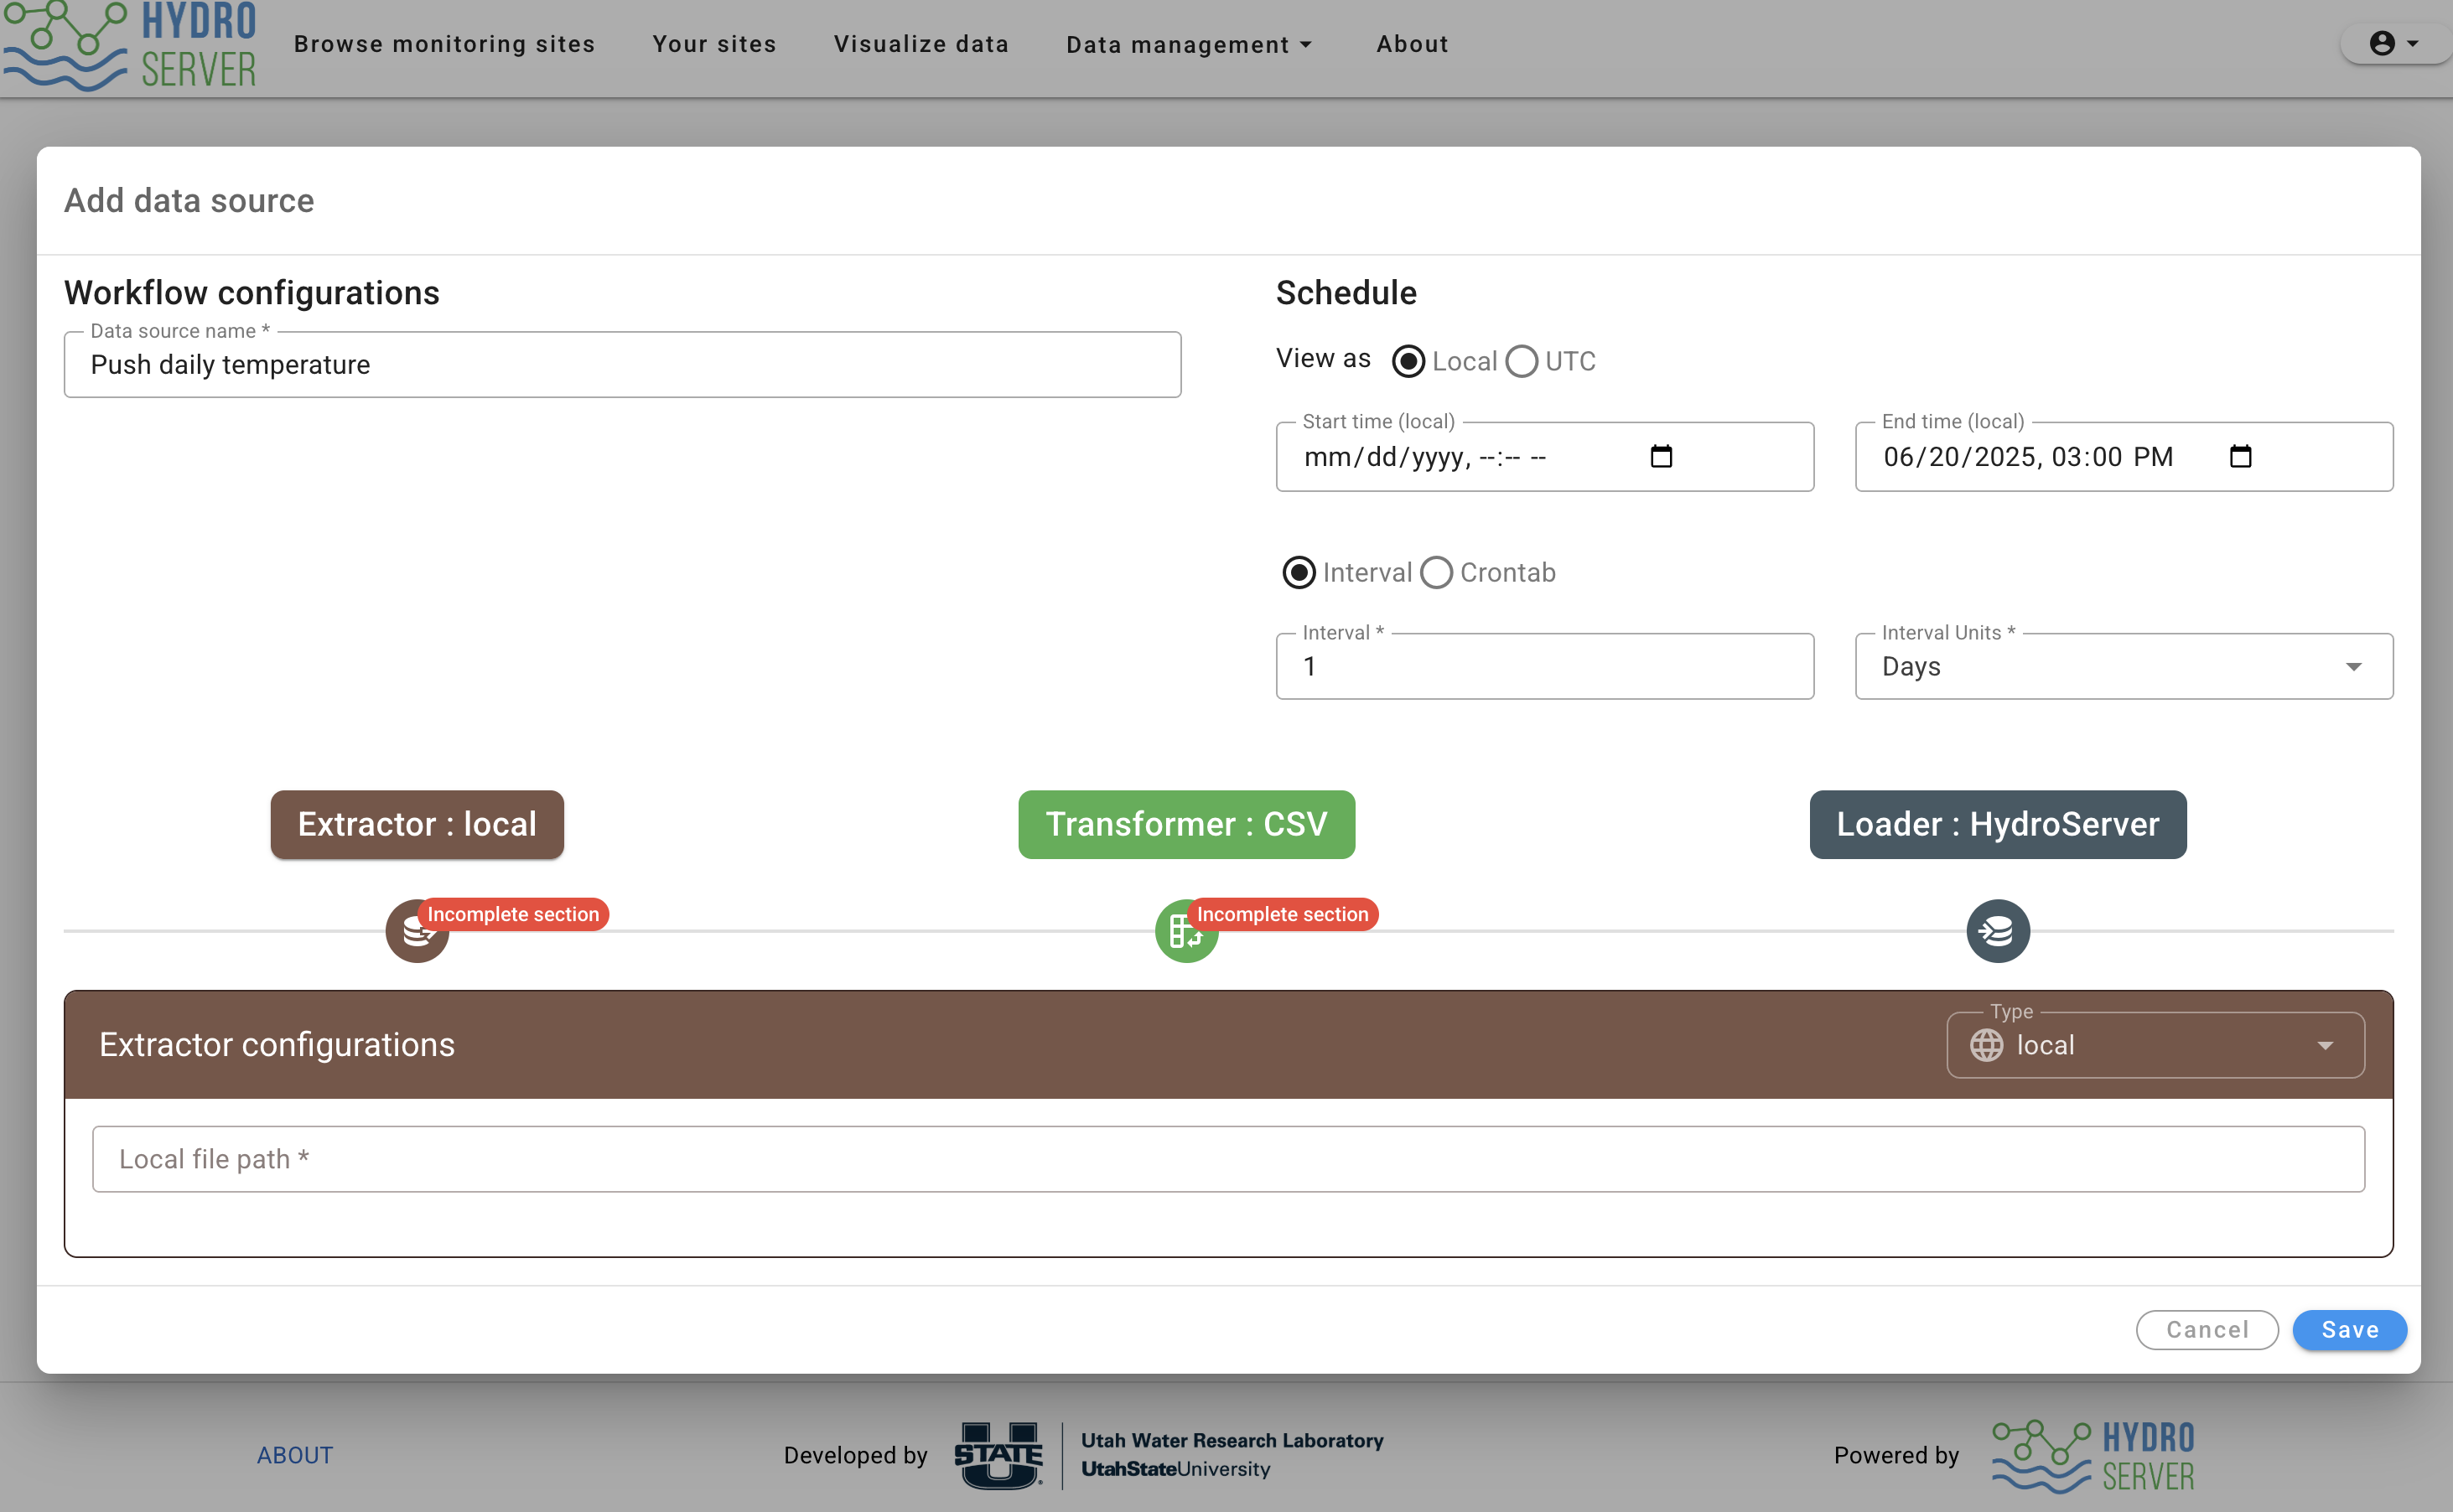
This will open the 'create data connection' modal with an empty form that contains schedule information on the top, and extract, transform, load step on the bottom. The purpose of this data connection is to tell the Streaming Data Loader to push daily temperature data from a CSV file to HydroServer. Therefore, I'll name this data connection:
- Name: Push daily temperature data
Set a schedule
Since this is just a tutorial, I don't want my Streaming Data Loader instance running constantly checking for new data. I want to run this once, then pause the schedule so I'll set the end time for about an hour from now. We'll leave start time empty since we just want this to run as soon as the Streaming Data Loader receives the data connection instructions.
Normally, this script would run indefinitely. So, interval is for setting how often you'd like the Streaming Data Loader to check if there's new data in the CSV file and push it to HydroServer if there is. Since it's daily data, we'll say every 1 day.
Configure ETL
Extract
Next, we need to specify where our data is coming from. In this case, we're pulling it from a local machine (the same machine that the SDL is running on), so we'll keep the extractor type set to 'local'. Fill our your absolute local file path. For me on Mac it's:
/Users/daniel/Desktop/daily_temp.csv
For windows users, this will be something like:
C:/users/daniel/Desktop/daily_temp.csv
Transform
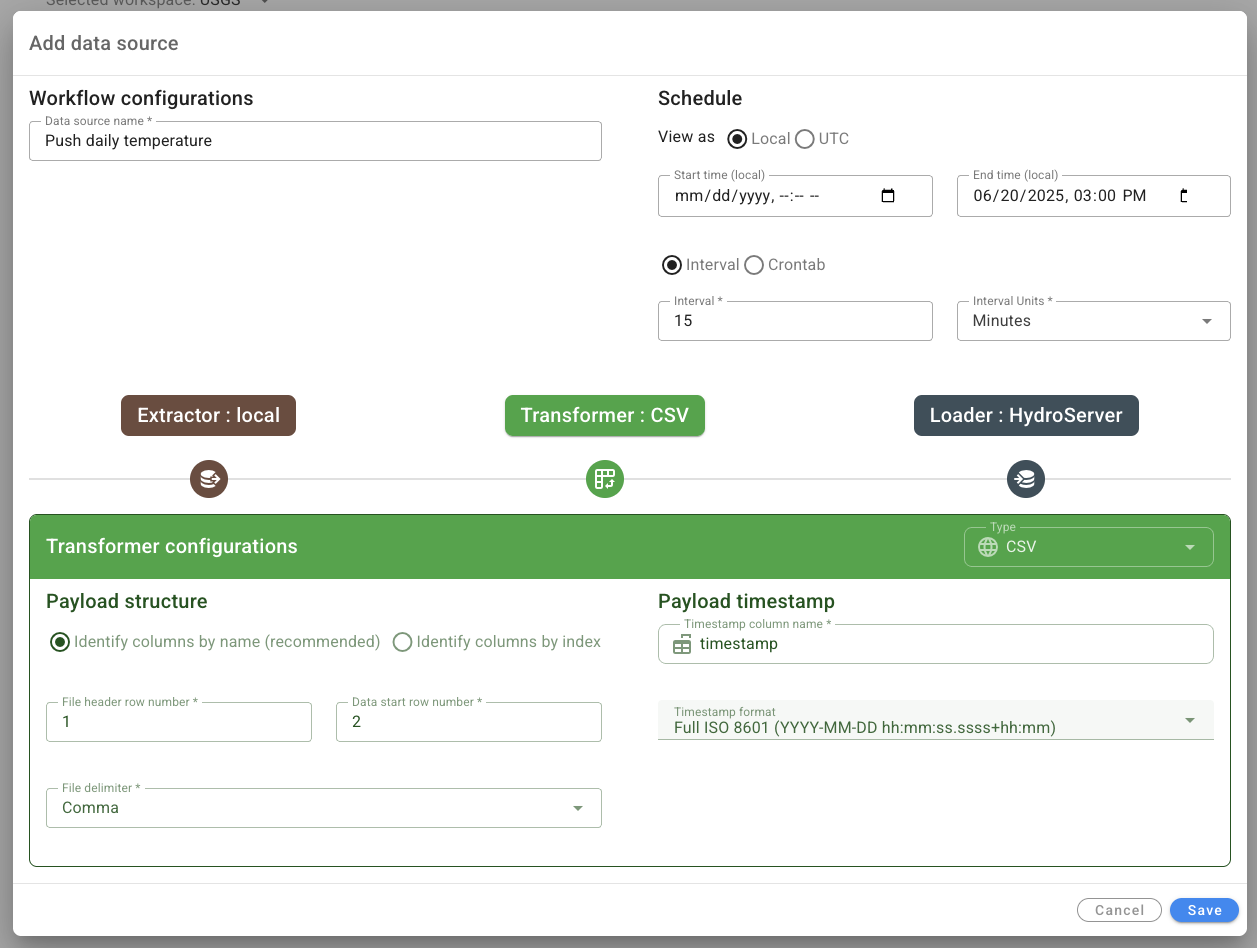
Click the green 'Transformer' to switch over to the next part of the form. This tells the Streaming Data Loader what to expect the CSV file to look like so it can pull out the 'temperature' and 'max_temp_c' columns we're interested in. The defaults are almost all what we want. The name of the column that contains timestamps is named 'timestamp'so that's what we'll put in the 'Timestamp column name' form field. Everything else should be good.
Load
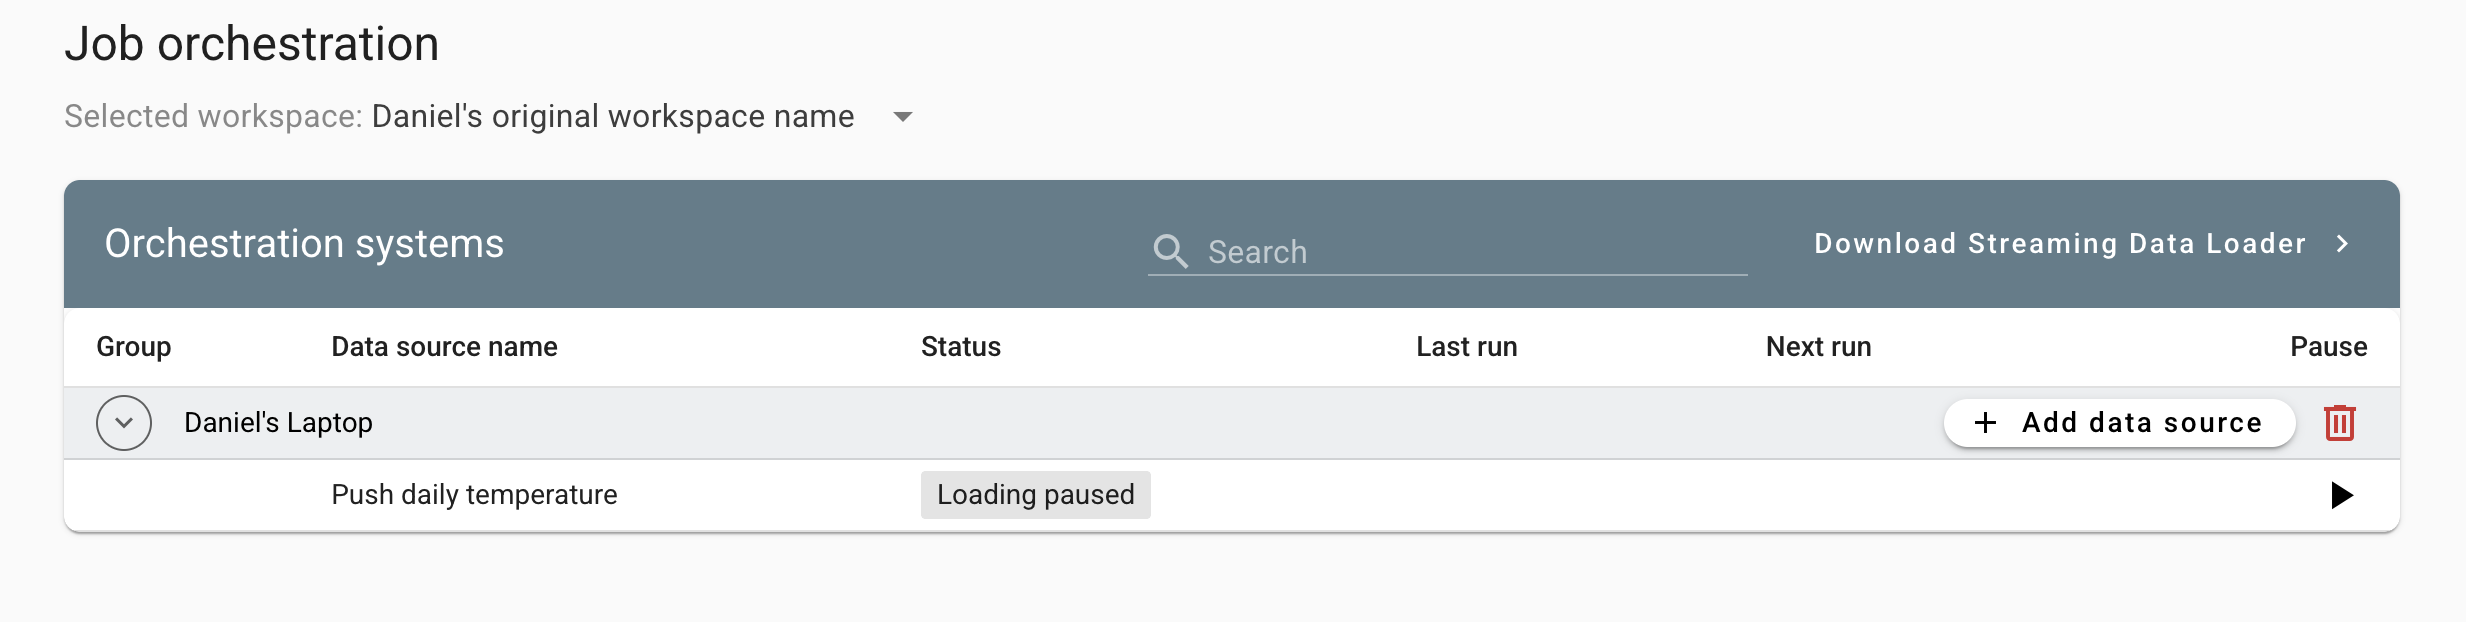
The default is HydroServer which is what we want and there are no configurations we need to set here. Click 'save' to create your data connection. This will create a new data connection that's paused by default. Keep it paused for now since there's one more thing we need to do before we can load the data.
Configure a payload
We've specified where we're extracting from (a CSV file), how to interpret the payload that's extracted, and that we want to load into HydroServer. But we haven't specified exactly which column of the CSV file will be pushed to which datastream. We'll do that next.
Click the table row that contains your new data connection. This will send you to the 'Data Connection Details' page of the data connection you just created. Near the bottom of the page, you'll see a table labeled 'Payloads for this data connection'. A payload in HydroServer is one CSV file or JSON file. Click the 'Add new payload' button.
The modal that pops up will let us point the max_temp_c column in the CSV file to our datastream in HydroServer. The name of the payload is 'daily_temp.csv' (it can be whatever you want). Click 'Add row'. On the left, fill in 'max_temp_c' as the column we're pulling from. On the right, open the datastream selector, select the name of the site you created from the 'select a site' drop down, and find and select your datastream in the table.
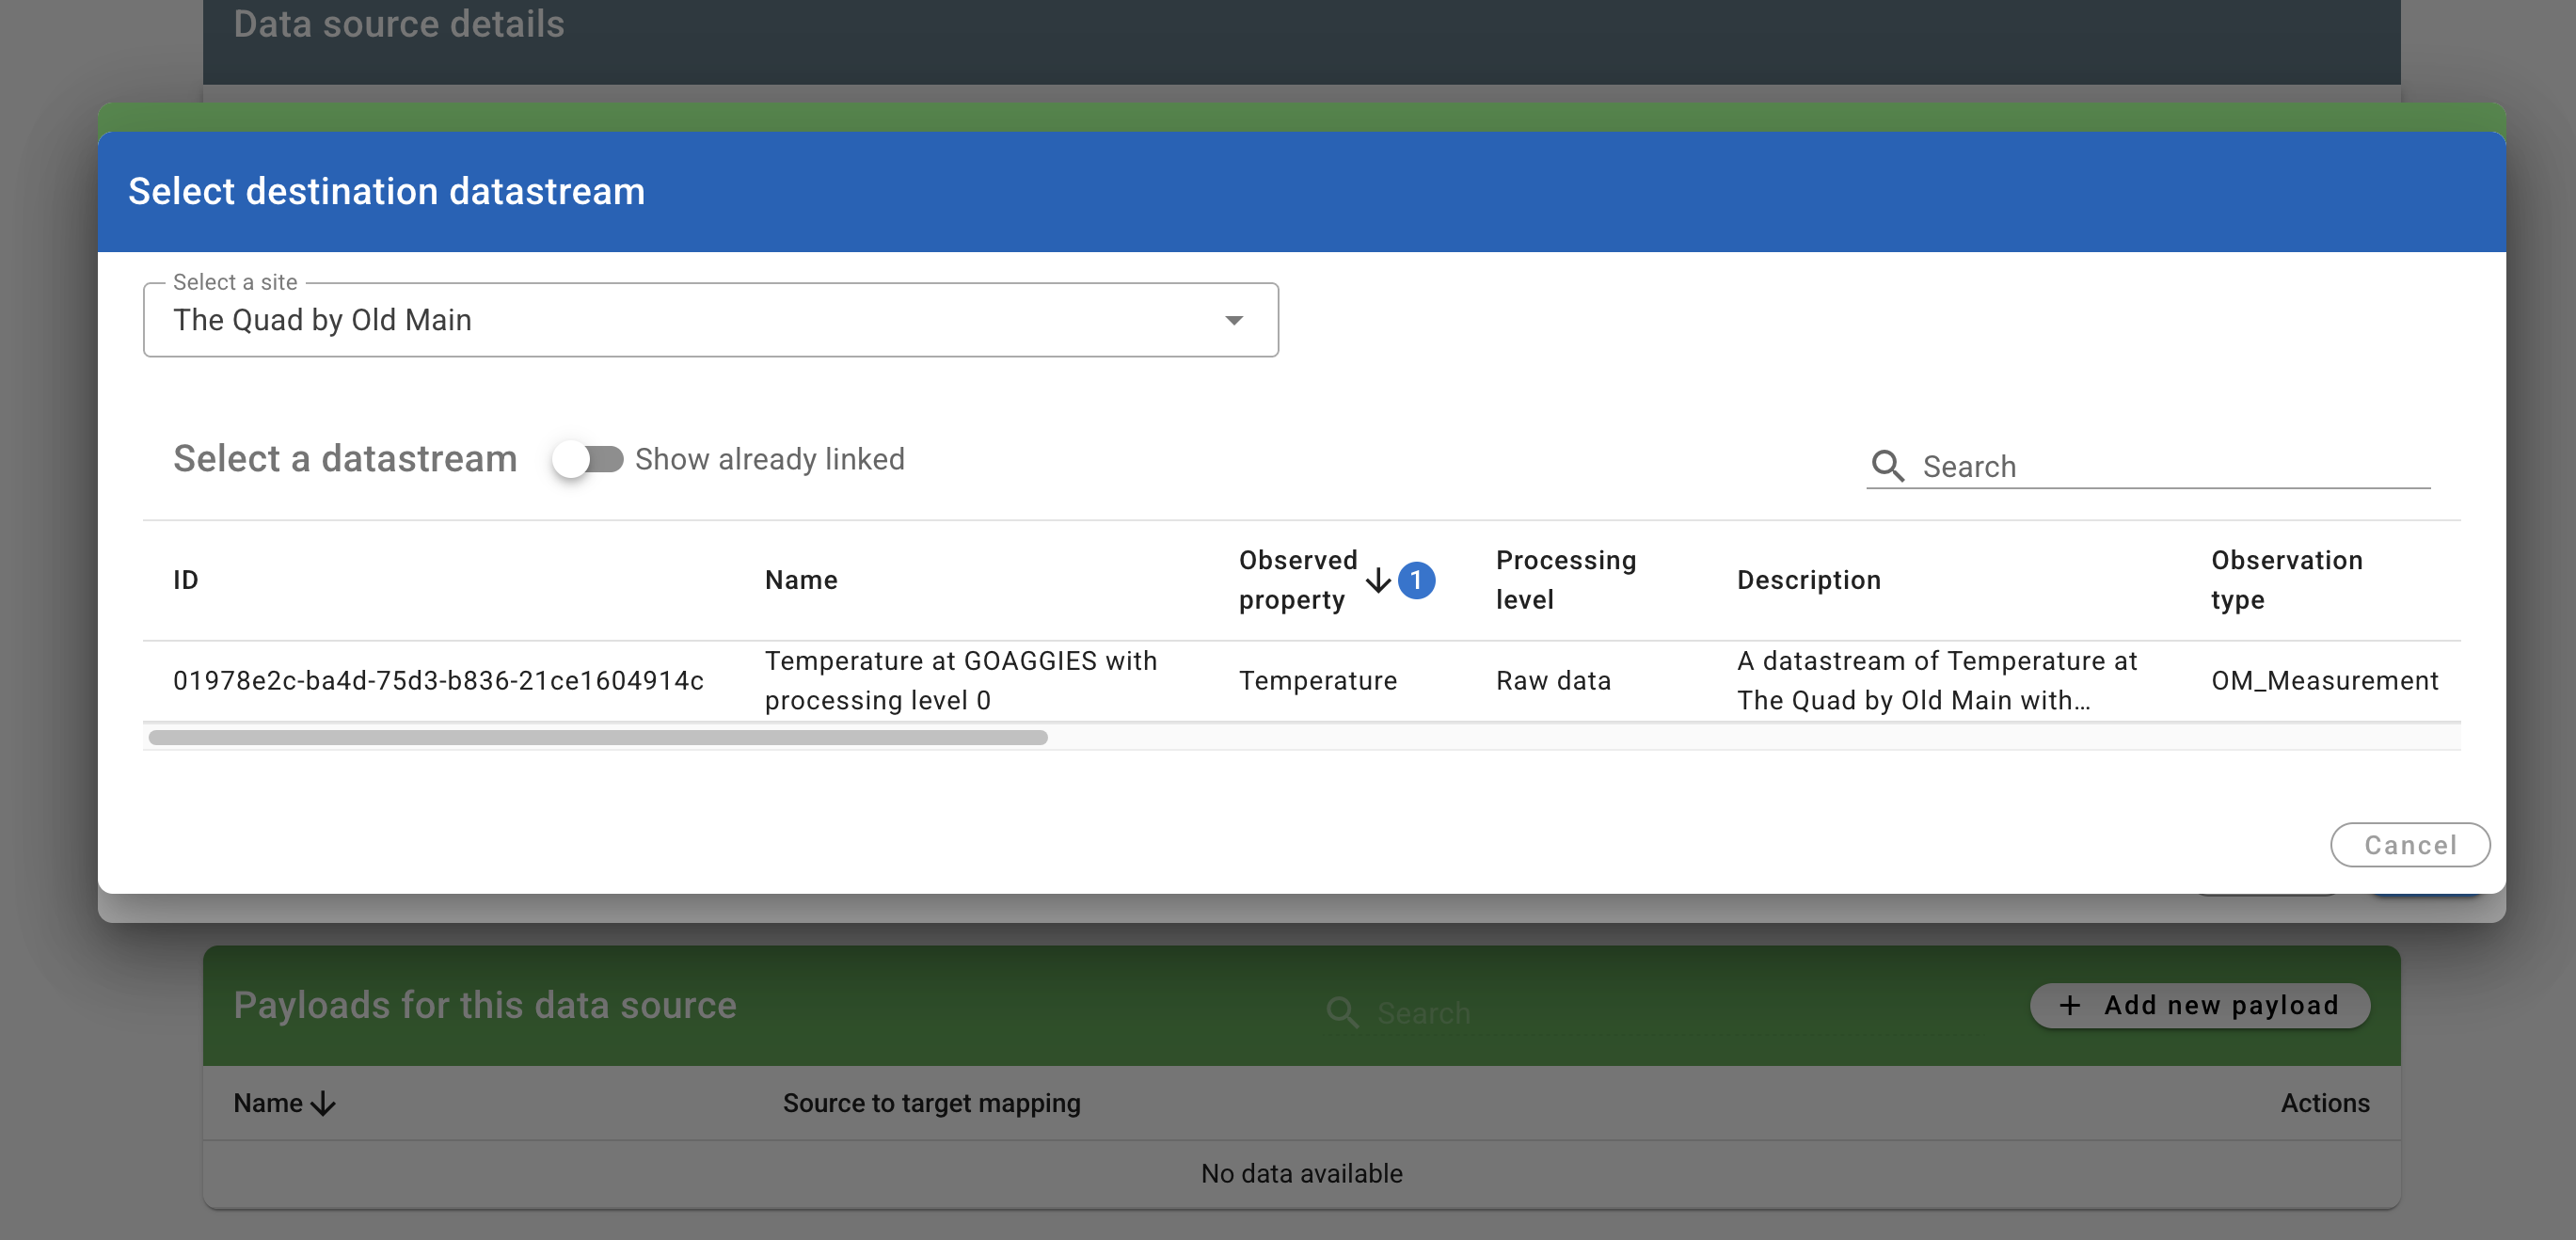
The payload form will now show max_temp_c mapped to your datastream. Click 'save'.
We now have written all the instructions the Streaming Data Loader needs to orchestrate our first workflow. Click the "Pause/Run" button at the top of the data connection details page and wait for your data to come streaming in!
The Streaming Data Loader will check for new data connections every 5 minutes, so it may take up to that long before you see your data. The data connection details page will display a 'Last run message'. Refresh the page to check if the Streaming Data Loader has attempted to run your data connection. It will display a green 'OK' if everything went well or a message if there was a network or configuration problem. The Streaming Data Loader also keeps a detailed log file you can open if anything goes wrong. To get to the logs,in the menu bar extras of your computer (top most icons), find the one for HydroServer and click it. Logs will be one of the options.
Visualizing Your Data
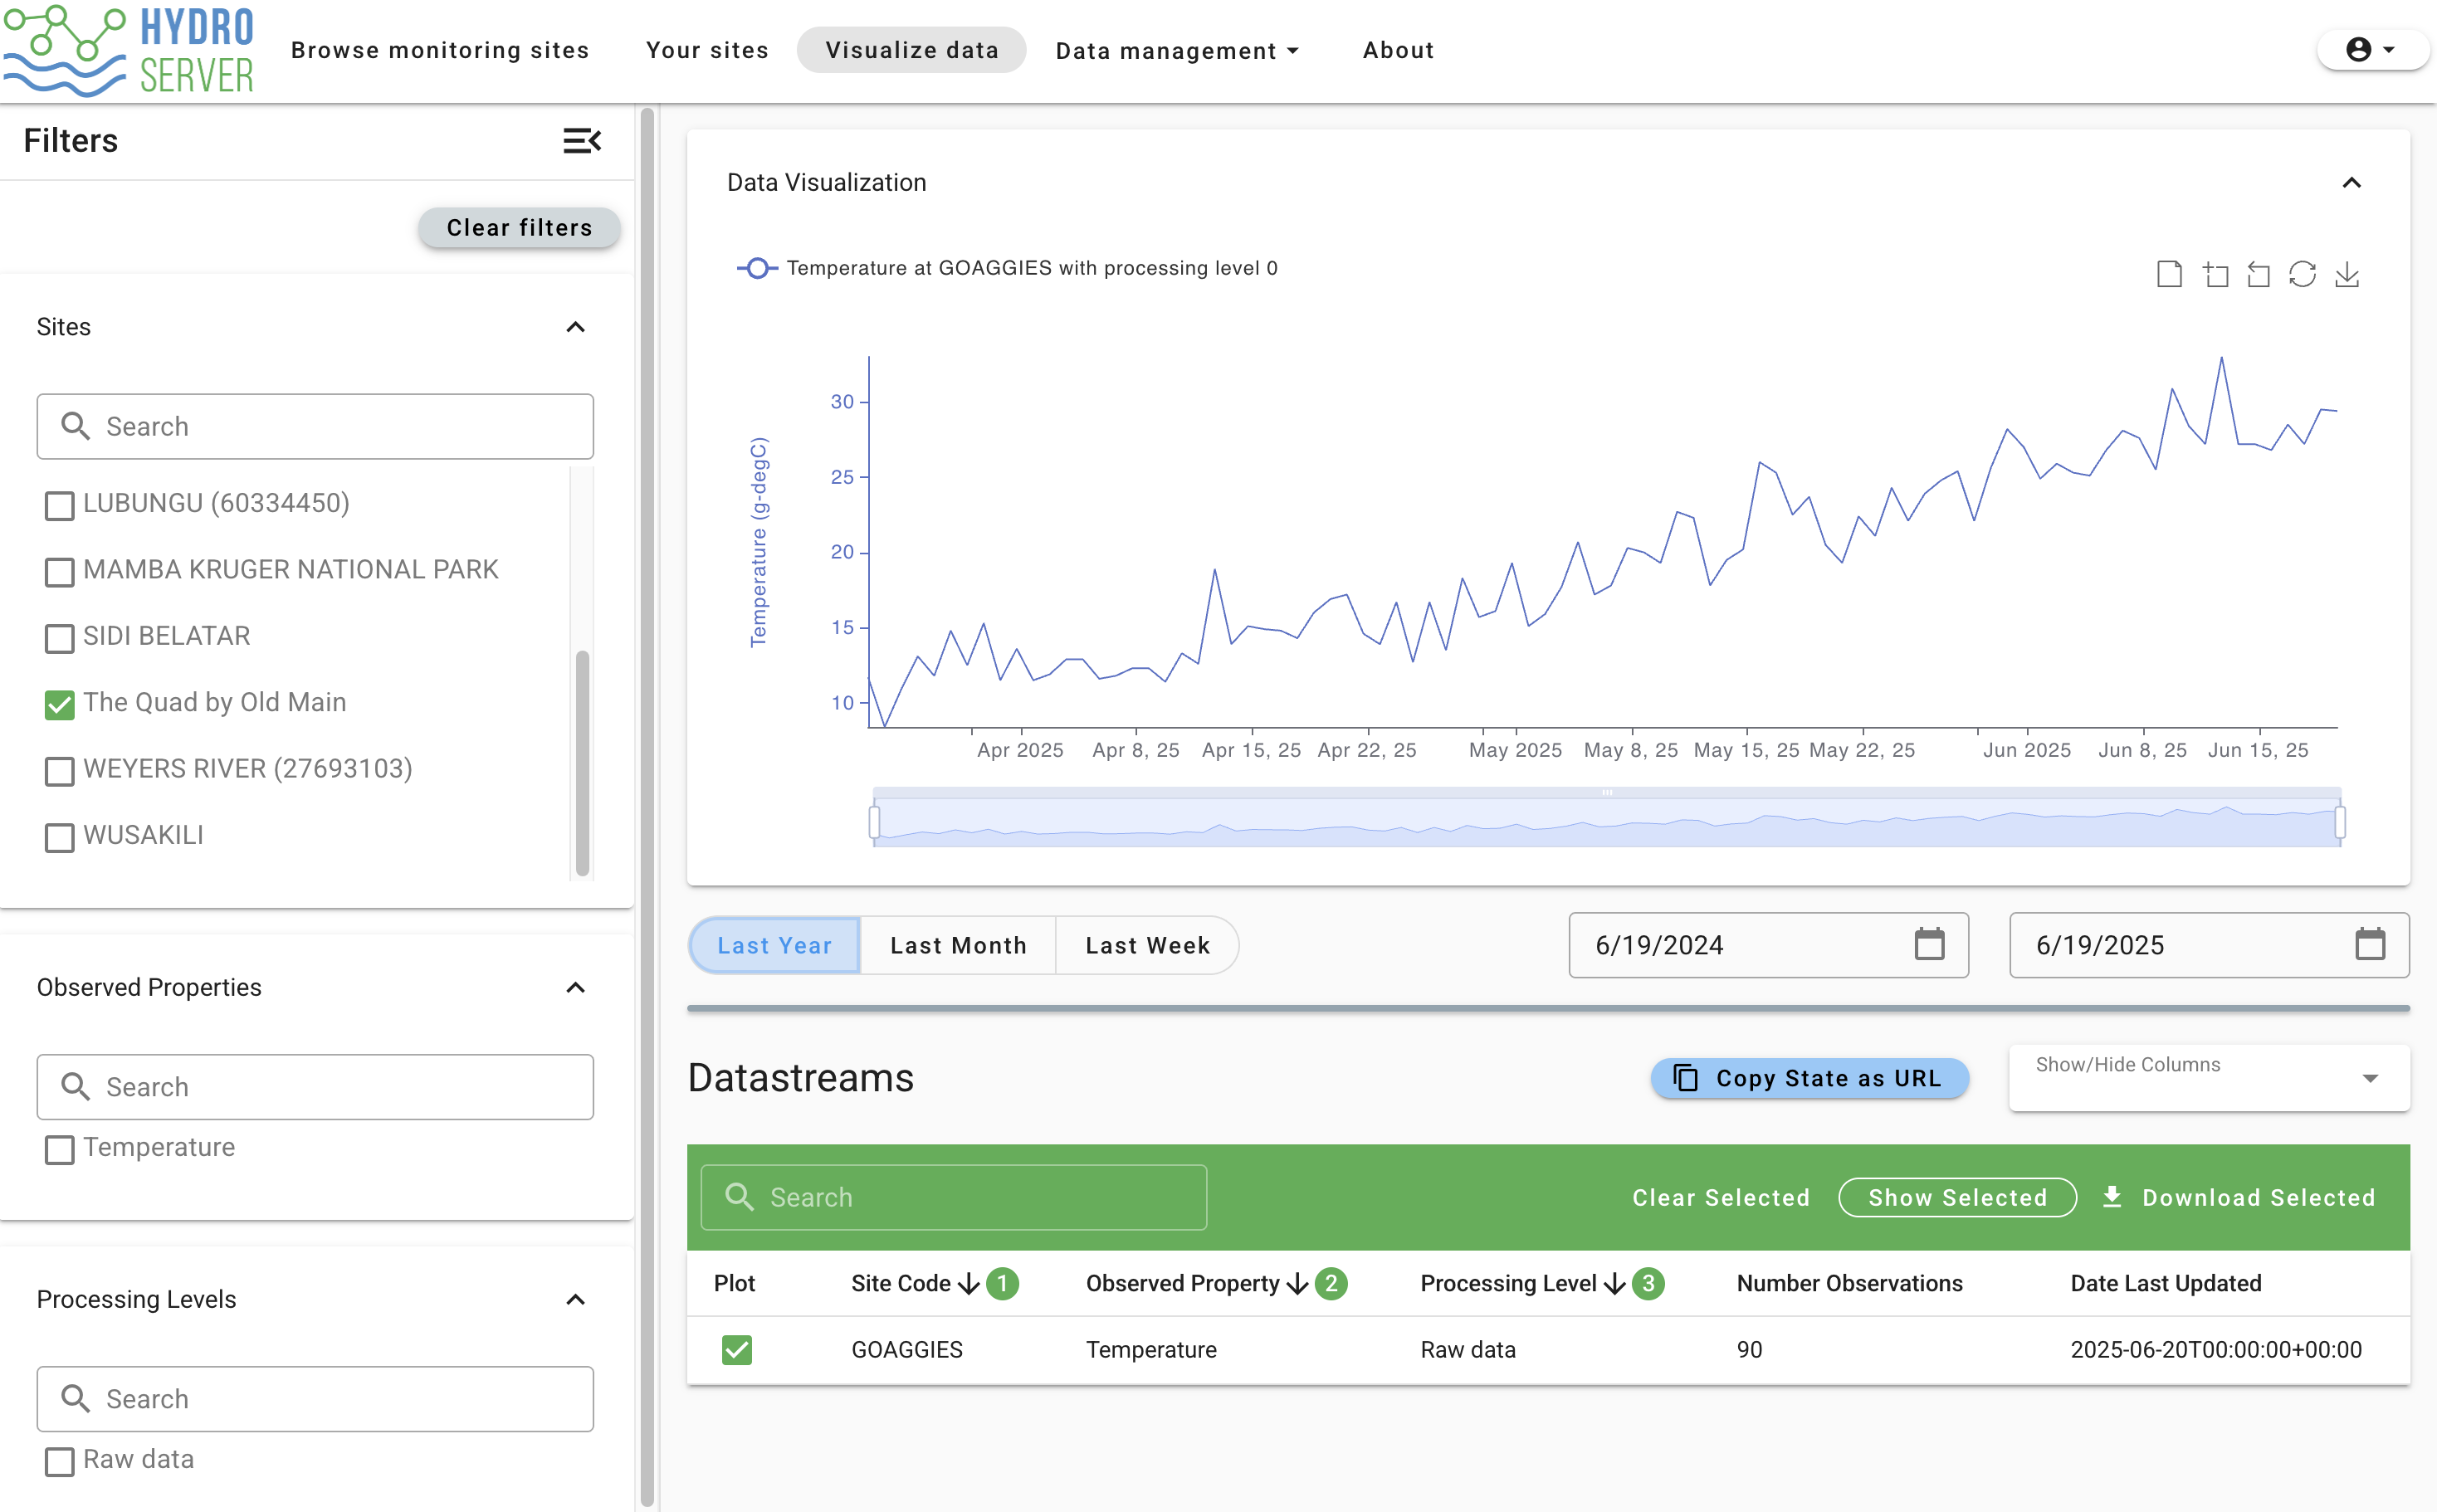
Congrats! You've completed this tutorial! To visualize your newly pushed data, click 'Visualize data' on the main navigation bar in the Data Management App. This will take you to a page where you'll see all the public data on the playground instance and your data regardless of if it's public or private (don't worry, private data still can't be seen by others). Use the 'Sites' filter on the left to find your site if you want to filter out everyone else's data. Select your datastream in the Datastreams table, filter by time range, and you should see something like this:
Where to go from here
I recommend solidifying your knowledge by trying out some data loading workflows on your own. To start, you might:
- Create a second datastream for the min_temp_c column we ignored earlier in the tutorial and add a mapping for it in the payload configuration.
- Try setting up a datastream and data connection to fetch real data from a live HTTP API.
- Read through the documentation to see what tools are available and relevant to you and play around with them.